










ROI Calculator
Your Total Investment
Other investmentsOptional
Only include items you plan to invest in. Leave the rest at zero.
Your estimated cost is added; this projection does not calculate catering revenue.
See catering food trucks ↗This tool excludes shipping and taxes; the cart estimates them once you select your state.
Your restaurant data
Editable starting point, not an industry average: The calculator starts with 50 customers/day, 6 days/week, 1 dish with the increase per customer, an illustrative $25 ticket and a $0.10 increase. Change any field with your own register data.
Divide the dishes that will carry the increase by the customers served. Example: 8 dishes for 10 customers = 0.8. Use 1.0 only if you don't have the data.
Optional visit scenarios
Each scenario uses the customer increase you estimate and a limited time frame. Don't count the same customer in more than one initiative; awards or publicity don't guarantee more visits.
Visible renovation: furniture, paint and reopening
A coordinated visual upgrade and announcing the reopening can help the change get noticed. Estimate only the additional visits you attribute to this initiative.
Reference observed in full remodels of US BURGER KING restaurants (2018–2024): median visit increase 9.6%; average 11.6%. These are not guaranteed minimums or maximums and don't predict your restaurant's result. See source and methodology (Item 19, 2026) ↗
A rebuild is a full reconstruction and is not comparable to a regular renovation. The percentage is converted into estimated additional customers based on your current customers per day.
Estimated additional customers per day
Fresh-made tortillas
Include the equipment in the investment and enter the additional visits you expect from offering them. The calculator uses the average ticket you entered.
Recognition, awards and publicity
Log local press, a nomination or a publicity campaign here. We don't assume a restaurant will win an award or that recognition will drive traffic; enter your own estimate.
Analysis results
Estimated payback for this scenario
—Enter your furniture cost to see how long it takes to recover it
Extra gross revenue per month (start)
$130
Estimated 3-year gross return
—
This scenario assumes you keep the per-dish increase for the projected period; additional visits only count for the duration entered. Figures are estimated gross revenue before costs. Demand may not change as projected.
Financial projection
Next step: Pick your furniture in the catalog and add it to the cart: you'll see shipping and taxes for your state and can include this analysis in your quote.
Or call us: (855) 500-2129
Why use it
Why use our calculator?
Informed decisions
Explore a simple payback period based on the data you provide. The result is an estimate, not a promise.
A scenario that fits you
You set the per-dish increase and, optionally, the percentage of additional visits you expect after a major renovation. You can check the median and average observed in a sample of BURGER KING remodels or enter your own assumption. Painting or coordinating other changes can make the renovation more noticeable, but doesn't guarantee more customers.
3-year projection
See estimated incremental gross revenue. It is not profit: food, payroll, taxes and demand changes are not deducted.
FAQ
Frequently asked questions
How does the ROI calculator work?
Enter the investment and your restaurant's daily numbers. You set the per-dish increase. For a major renovation you can pick the observed visit references or type your own percentage and how many months you expect the effect to last. The calculator converts the percentage into estimated additional customers based on your current customers per day. The figures are references, not minimums, maximums or demand guarantees.
Is the calculator free?
Yes, our ROI calculator is 100% free. No sign-up or personal data required.
What does dishes with the price increase per customer mean?
It's the average number of dishes per customer that will carry the increase. Divide eligible dishes sold by customers served in the same period: 8 dishes for 10 customers = 0.8. The starting value of 1.0 is editable and is not an official industry average; use your sales reports for more precision.
What price increase should I enter?
You decide the per-dish increase. The calculator illustrates $0.10, $0.20 and $0.50, but you can edit the amount. Results are estimated gross revenue before costs, not profit.
How long does it take to recover the investment?
There's no universal time frame. It depends on the investment, sales, the price change you choose, costs and any temporary additional visits you estimate. The tool calculates from those assumptions and does not guarantee payback.
Can I save my calculations?
You can currently add the analysis to your quote when you add products to the cart. You can also take a screenshot of the results.
Ready to renovate your restaurant?
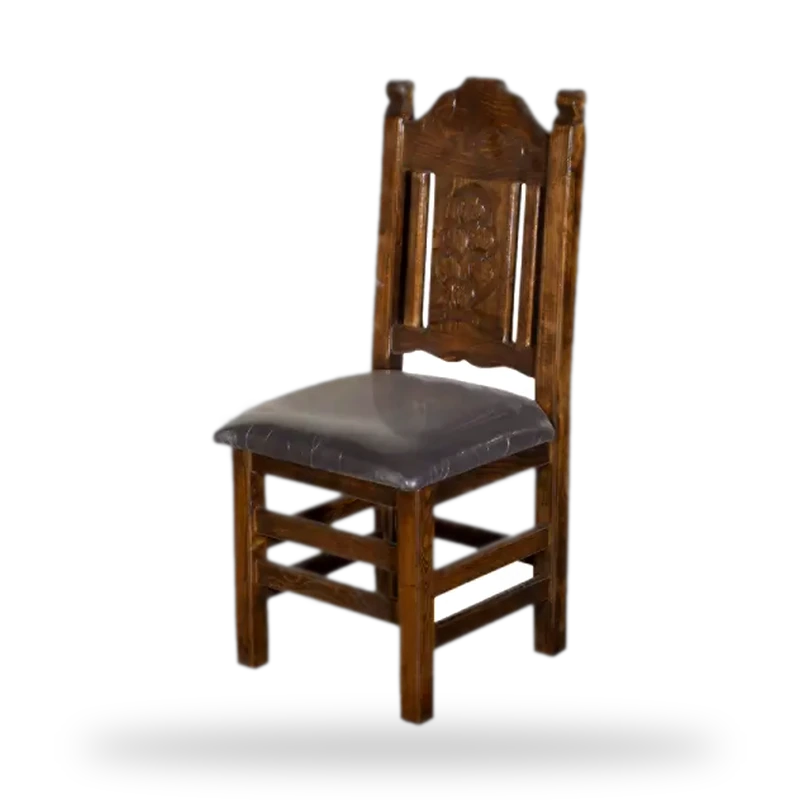
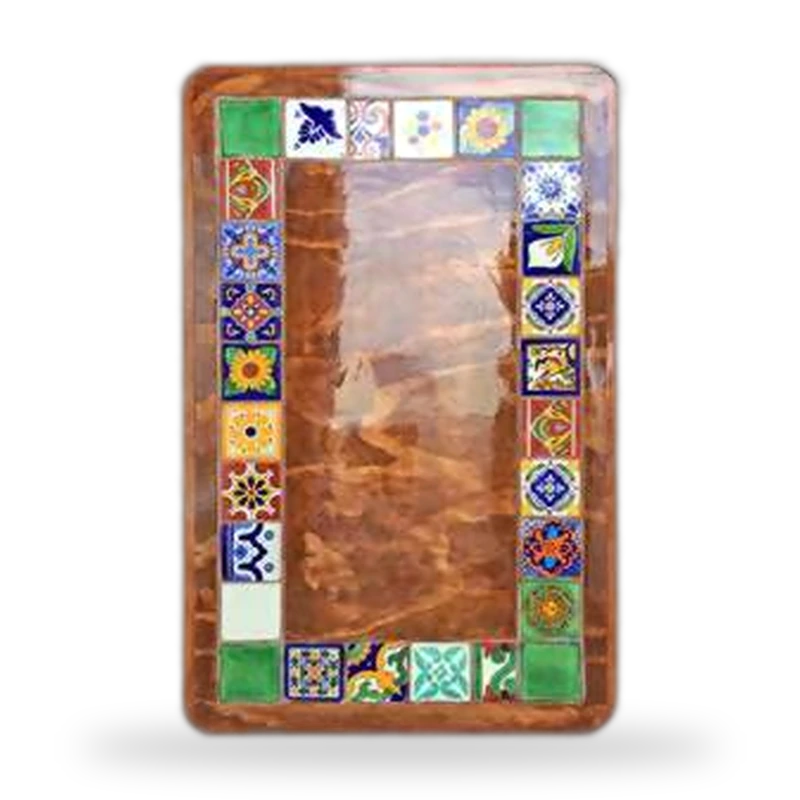
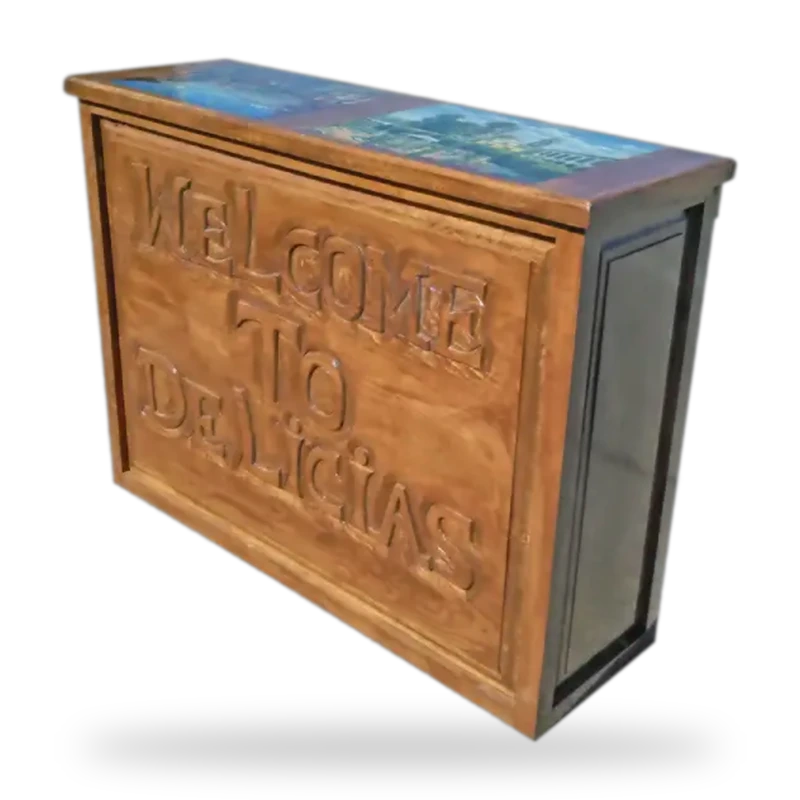
Explore our handcrafted Mexican furniture, in up to 52,480 color combinations per piece.